After having a few near brushes with the limit of my monthly 500 MB data plan, I became quite curious as to which apps were using up my data and when. After all, I spend half the day connected to a wifi network; there is no reason to be consuming 500MB through casual use.
Many service providers have some way of showing your data history, either through a website login or via an app but that’s a rather vendor-specific solution. My Data Manager, a free app in Google Play, is awesome and independent. It offers several views into your data use, wifi use, and where you stand in your monthly allotment.
Do you like tabular numbers? Coloured charts? Even a simple X remaining MBs notification? It’s all here under one easy-to-use app.
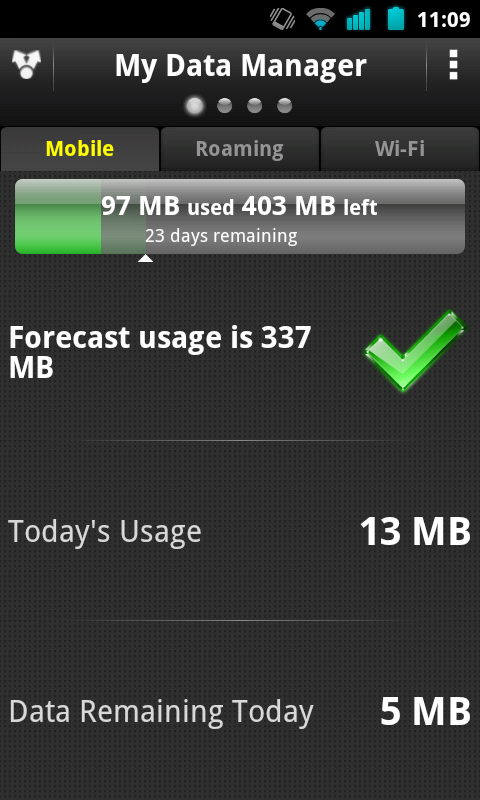
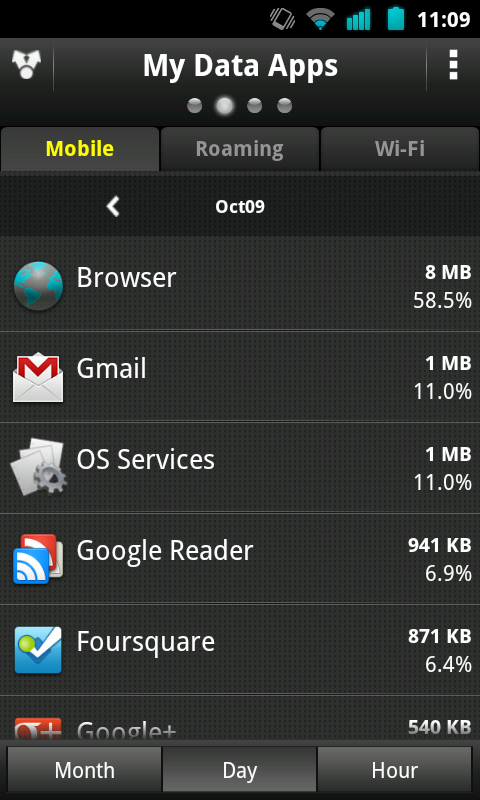
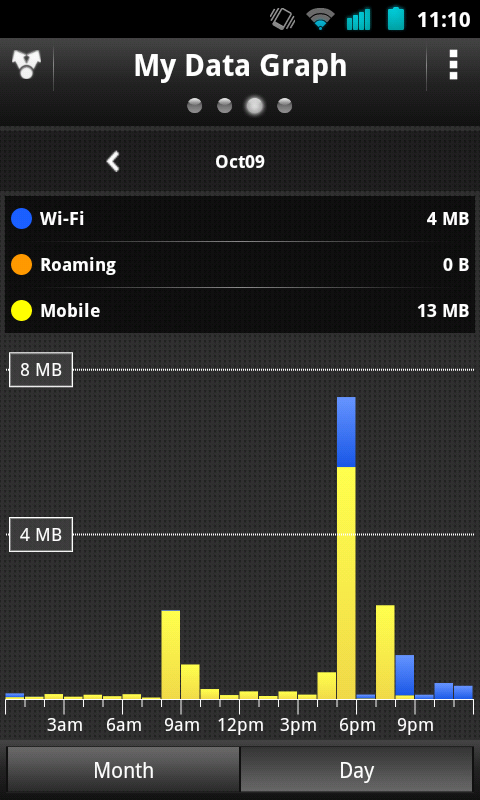
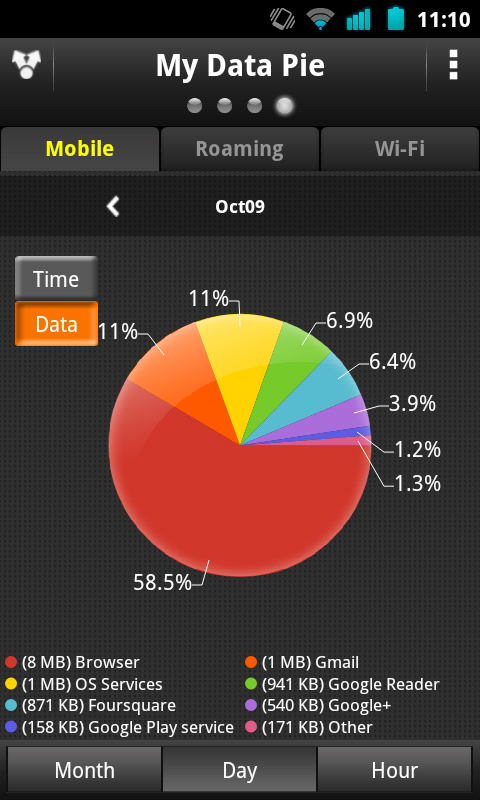
I personally like the Data Manager view, telling me how much data I have used and how much I have remaining, but the coloured charts have proven to be particularly useful in bringing attention to data usage peaks and in isolating greedy apps. The stacked bar graph over time is great for showing you your data usage trends. For example, this screenshot brought to my attention that my phone did not connect to the office wifi today, although there was minimal traffic during that time, and that there was a spike in usage during my commute home, while I caught up with Facebook. The pie chart showed me that the browser consumed the bulk of the data today, although the RSS reader has been shown to take the lead some days.
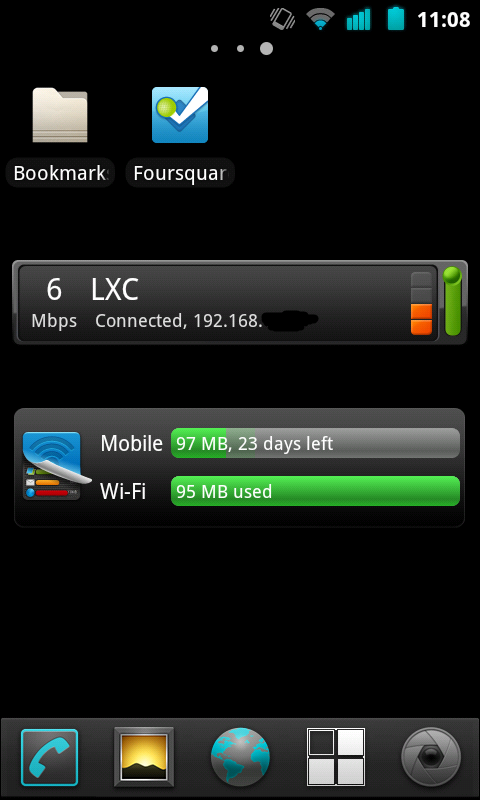
The icing on the cake, the My Data Manager app also provides a nice widget which shows how much of your monthly allotment you have consumed. I don’t have a screenshot but this widget is also embedded in the Android pulldown notifications bar, for tidy but convenient access.
I have will definitely continue using My Data Manager and recommend it to all Android users. Go ahead and download it, give it a try.
